01· Measured at the wire, not estimated
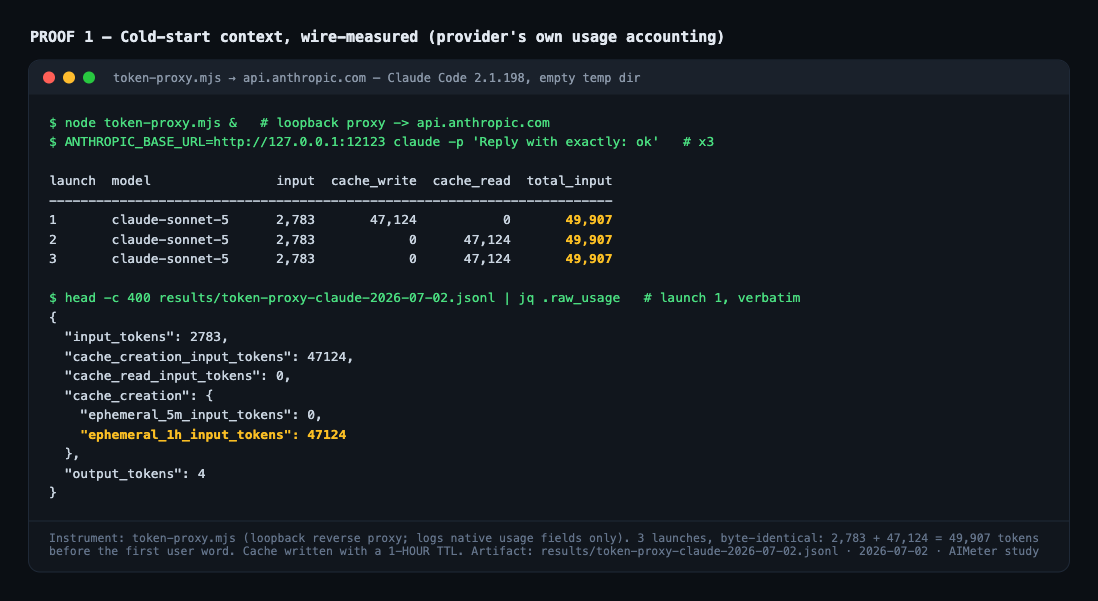
Token-counting tools model what an agent probably loads. I wanted the number the
provider actually bills, so I built a small loopback reverse proxy, pointed
ANTHROPIC_BASE_URL at it, and logged every
response's native usage fields. Three cold launches of
Claude Code 2.1.198 from an empty directory:
2,783 uncached + 47,124 cached prefix = 49,907 tokens, identical every time —
system prompt, tool schemas, skills, memory, all loaded before the first user word.
One caveat the data itself teaches: absolute cold-start size is a per-CLI-version snapshot — it moves as the CLI ships new tools and prompts. The mechanisms below, however, replicate — they are architecture facts, proven with deltas.
02· File scans lie; token deltas don't
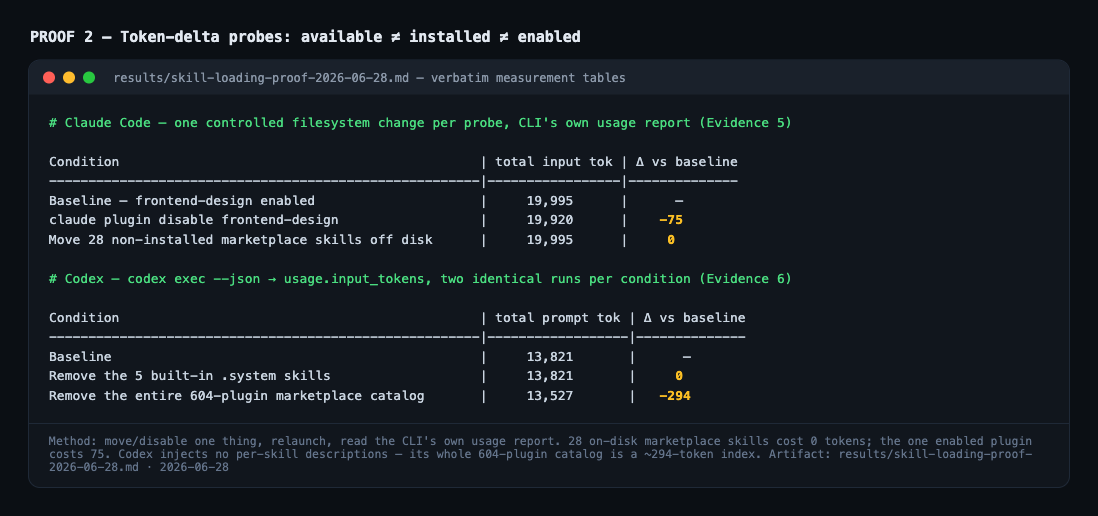
My disk shows 29 Claude Code skills. The runtime loads exactly 1 (~78 tokens — the one enabled plugin). The proof is a controlled experiment, not an opinion: move every non-enabled plugin's skills off the disk, relaunch, read the meter — the cold-start context shifted by 2 tokens. Moving the 28 marketplace skill files themselves: exactly 0. Disabling the one enabled plugin: −75. Available ≠ installed ≠ enabled — and most audit tooling measures the disk, so it over-counts.
Codex is the counter-example that proves the design point: its entire 604-plugin marketplace catalog costs ~294 tokens at cold start (~0.5 per plugin — a compact index), and deleting its 5 built-in skills changed the prompt by exactly 0. Codex ships progressive disclosure by default.
03· The cross-CLI picture
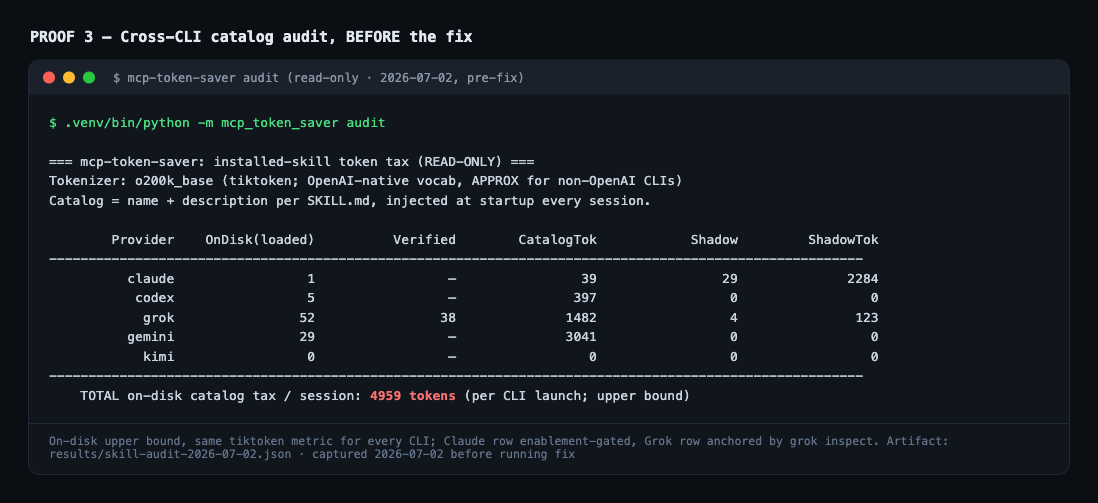
Across five CLIs — Claude Code, Codex, Gemini, Grok, Kimi — the on-disk skill-catalog tax on my machine topped out at 4,959 tokens per session (an upper bound: runtimes load subsets, which is exactly why the audit defers to each CLI's own inspector where one exists). The surprise: the biggest catalog isn't Claude's. Gemini carried ~3,000 tokens on disk while Claude's enabled catalog was 39.
And the quieter tax: in the controlled harness, activating a set of 15 skills adds
~3,000 tokens to every session start whether your
project rules are 100 tokens or 8,000 — and even never-invoked skills cost
~400 tokens of metadata. On my own machine,
/doctor once dropped 30 skill descriptions because unused ones
flooded the listing budget: the skills I needed lost context to the ones I didn't.
04· The fix, measured with the same instrument
The remedy is structural: consolidate every CLI's skills into one on-demand vault served over MCP — the catalog leaves the startup prompt entirely, and a skill's body enters context only when the model actually asks for it. Applied on my machine and re-audited with the same instrument: 4,959 → 319 tokens per session.
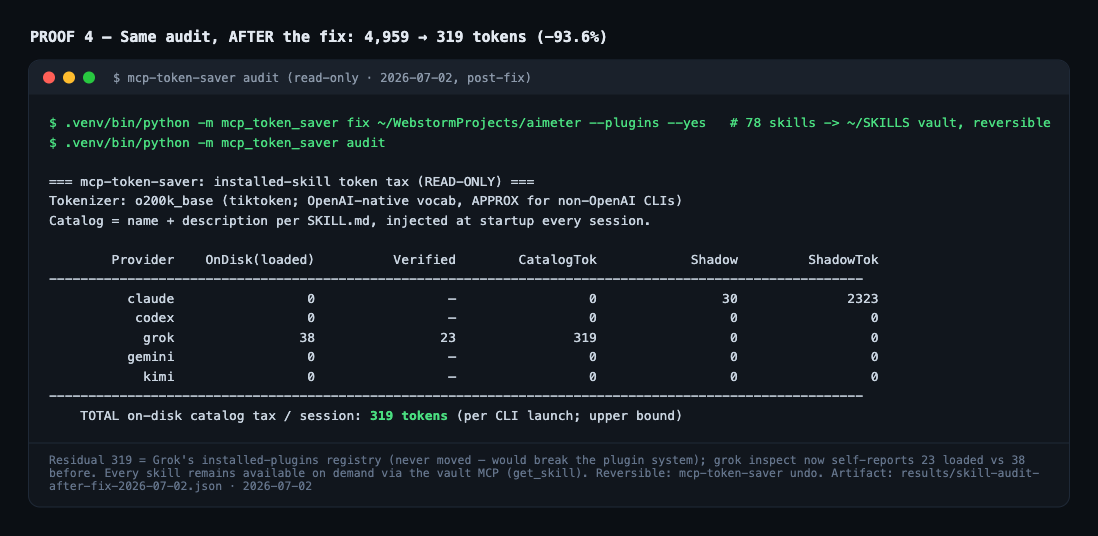
Then I re-tested the runtimes themselves, because rule one of this work is that the audit is not the ground truth — the runtime is. Gemini's own inspector went from 9 skills loaded to 0. Grok's went from 38 to 23. And the re-test caught a survivor: Claude Code serves enabled plugins from a cache copy, so its one plugin skill was still loaded. I patched the tool to relocate the cache copy too and re-tested until the runtime confirmed it gone — 16 skills listed before, 15 after, the plugin's skill no longer among them. Stable cut once every quirk is counted: ~86%, every skill still available on demand, and the whole change reversible with one command.
05· Three rules from the bench
- 1> Audit the runtime, not the disk. Probe with token deltas — the provider's usage numbers are the only ground truth.
- 2> Curate skills per project. Every description you carry is context your code doesn't get.
- 3> Keep the receipts. Screenshots, raw artifacts, and a re-run command for every number — a claim nobody can re-verify is marketing, not measurement.
06· The receipts
Everything above follows its own rule three. Behind each screenshot sits a dated raw artifact — the proxy's JSONL usage logs, the before/after audit JSON, the CLIs' own inspector outputs — plus a claim-to-evidence index mapping every number to its instrument and re-run command, and a cryptographic, tamper-evident logging chain for tool invocations.
The full write-up — methodology, raw measurement artifacts, and the verification chain — coming soon. If you want the short version in the meantime: measure the initial load of unused capabilities, then decide how much of it you actually need to pay for on every new session.